Most European countries are on a similar coronavirus trajectory to Italy and the projected numbers of deaths world-wide are deeply sobering
Em Português
One of the striking features of the COVID-19 pandemic has been the different trajectories of spread in different countries.
The epidemic started in China but after 81,000 cases and just over 3,200 deaths there have been no domestically acquired cases there in the last three days. The danger now for China is for the virus to come back to the country from overseas but it seems to have the virus well under control.
China’s remarkable success in controlling the virus is documented in the Report of the WHO-China Joint Mission on Coronavirus Disease 2019 (COVID-19) dated 16-24 February. You can read the whole report here but there is an excellent summary here (much more detail in my previous post here).
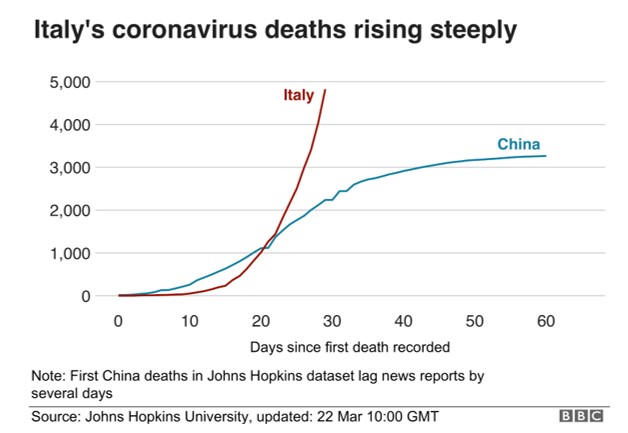
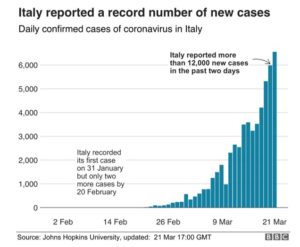
By contrast, in Italy the number of new cases is increasing exponentially. Italy has 7,500 deaths to China’s 3,200 but on a population basis Italy has 1,230 cases per million population to China’s 56.
In fact, of the 198 countries and territories now with coronavirus, 72 of them have more cases than China when measured in cases per million population. This 72 includes most of the countries in Europe.
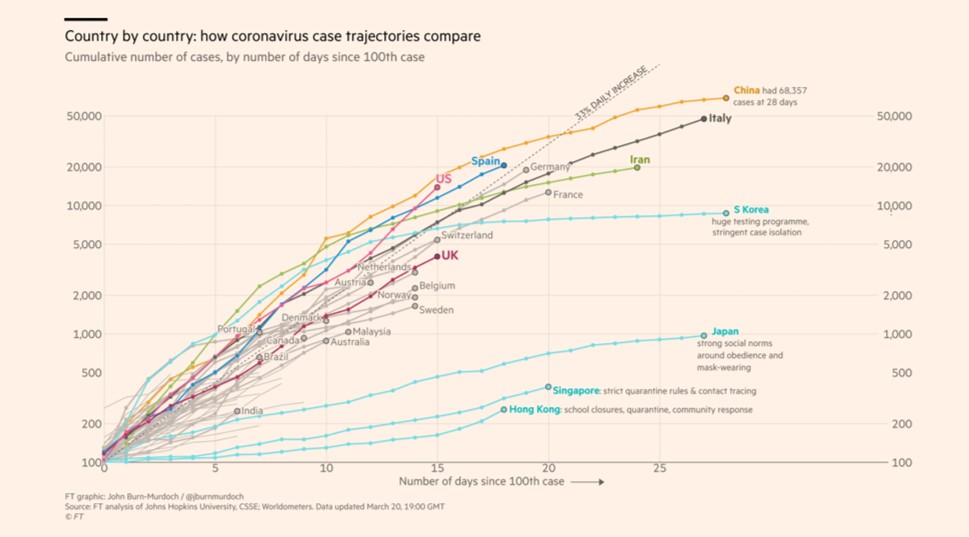
Eastern countries like Singapore, Taiwan, South Korea, Hong Kong and Japan are on a similar trajectory to China (see blue lines in graph below) – but most Western countries are following the pattern of Italy (see also here). The Financial Times has an illuminating series of graphs demonstrating this.
The World Health Organisation’s top emergency expert, Mike Ryan, speaking on 22 March on the BBC’s Andrew Marr Show, said that movement restrictions and lockdowns are not enough to control spread of the virus (video here).
‘What we really need to focus on is finding those who are sick, those who have the virus, and isolate them, find their contacts and isolate them,’ Ryan told Marr (see my previous post on the importance of testing here).
Much of Europe and the US, have introduced drastic restrictions on travel for non-essential workers, many of whom are now working from home, while schools, bars, pubs and restaurants have also been closed.
However, Mr Ryan said he believed these countries need to follow the example of countries like China, Singapore and South Korea, where these restrictions had been coupled with rigorous measures to test people suspected of having the virus.
‘Once we’ve suppressed the transmission, we have to go after the virus. We have to take the fight to the virus,’ Mr Ryan added.
As I argued last week, the failure of countries like the US and UK, has been not having enough testing kits to identify those infected. The UK is testing about 10,000 people a day while China was producing 1.6 million testing kits per week at the height of their crisis.
Singapore, like China, has a sophisticated and extensive contact tracing programme, which follows the chain of the virus from one person to the next, identifying and isolating those people – and all their close contacts – before they can spread the virus further.
As of 26 March, Singapore had confirmed 631 cases and no deaths. For about 40% of those people, the first indication they had was the health ministry telling them they needed to be tested and isolated.
In total, 6,000 people have been contact-traced to date, using a combination of CCTV footage, police investigation and old fashioned, labour-intensive detective work – which often starts with a simple telephone call.
By contrast, in the UK, we failed to do this in the early stages allowing the virus to steal a march on us.
Now, because of the lack of resources to check anyone other than hospitalised cases, we have junior doctors being quarantined at home for two weeks simply because their child has a cold – when a simple test could clear them to go back to work.
Similarly, potentially infected healthcare staff, who haven’t been tested because we lack the resources to test them, are at risk of spreading the virus around the wards.
We also have no way of knowing (because we are not testing) just how many cases there are in the UK overall or who has it and who doesn’t. Official figures show around 9,500 but government advisor Patrick Vallance admitted last week that the real number was closer to 55,000. Given the number of deaths in the UK already it may be much higher.
The best indication we really have of the seriousness of coronavirus in any given country currently is the number of deaths, but as death occurs on average 14 days after first symptoms (in those who die) this leaves us a long way behind the curve and means that any interventions we make may take some time to have effect.
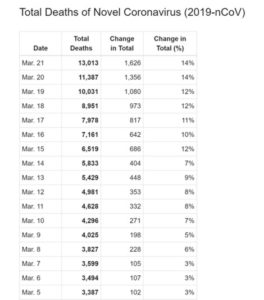
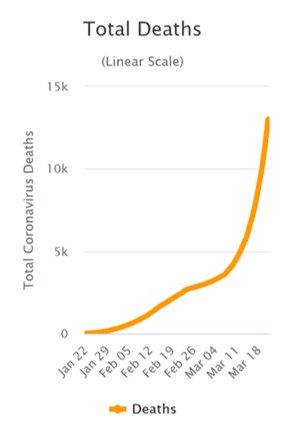
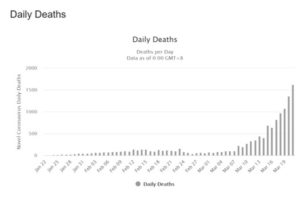
The number of deaths so far may seem quite small – only 21,000 in total globally by 26 March – but as can be seen from the numbers opposite (source here) the number of deaths per day increased from 100 to 1,600 in sixteen days between 5 and 21 March. This amounts to a doubling of numbers every four days, or a 19% increase daily. From 21 to 26 March the average daily increase was 10%.
If this trend were to continue, and I realise this is a big if because of the large number of potentially confounding variables not least interventions by governments, then a 10% daily increase globally would result in 41,000 deaths worldwide by 31 March, 100,000 by 9 April, one million by 3 May, two million by 10 May, five million by 20 May, ten million by 27 May and 15 million by 31 May.
So it is May when the increase will really kick in if we fail to stop it. The increases beyond this do not bear thinking about. I have put the figures in a chart below.
These numbers will of course be mitigated by preventive measures like rigorous testing, tracing and isolation – or by social distancing and lockdown – but this dramatic increase in numbers over time is the frightening effect of a 10% increase in daily death rates on the total number of deaths globally.
This is not scaremongering. This is simply what the maths shows – and is what happens when a virus that is as contagious as Ebola and 30 times more deadly than the flu (with a mortality rate of 3.0-3.4% according to the WHO – detail here) is allowed to establish itself in a population.
Unless curbed this will simply overwhelm our health systems with far more patients requiring oxygen and ventilators than we have capacity for.
This is why it is so crucial that we all play our part – for our leaders to get the policy right and resources right and for all of us to help make it work. But we are also going to need some supernatural help to beat this – more on that later.
The table below is based on a 10% daily increase in global deaths. The actual increase from 5 to 21 March was 19% daily and 10% daily from 21 to 26 March.
| Date | Daily deaths | Total deaths |
| 21/03/2020 | 1,600 | 13,000 |
| 22/03/2020 | 1,760 | 14,760 |
| 23/03/2020 | 1,936 | 16,696 |
| 24/03/2020 | 2,130 | 18,826 |
| 25/03/2020 | 2,343 | 21,168 |
| 26/03/2020 | 2,577 | 23,745 |
| 27/03/2020 | 2,834 | 26,579 |
| 28/03/2020 | 3,118 | 29,697 |
| 29/03/2020 | 3,430 | 33,127 |
| 30/03/2020 | 3,773 | 36,900 |
| 31/03/2020 | 4,150 | 41,050 |
| 01/04/2020 | 4,565 | 45,615 |
| 02/04/2020 | 5,021 | 50,636 |
| 03/04/2020 | 5,524 | 56,160 |
| 04/04/2020 | 6,076 | 62,236 |
| 05/04/2020 | 6,684 | 68,920 |
| 06/04/2020 | 7,352 | 76,272 |
| 07/04/2020 | 8,087 | 84,359 |
| 08/04/2020 | 8,896 | 93,255 |
| 09/04/2020 | 9,785 | 103,040 |
| 10/04/2020 | 10,764 | 113,804 |
| 11/04/2020 | 11,840 | 125,644 |
| 12/04/2020 | 13,024 | 138,669 |
| 13/04/2020 | 14,327 | 152,996 |
| 14/04/2020 | 15,760 | 168,755 |
| 15/04/2020 | 17,336 | 186,091 |
| 16/04/2020 | 19,069 | 205,160 |
| 17/04/2020 | 20,976 | 226,136 |
| 18/04/2020 | 23,074 | 249,209 |
| 19/04/2020 | 25,381 | 274,590 |
| 20/04/2020 | 27,919 | 302,509 |
| 21/04/2020 | 30,711 | 333,220 |
| 22/04/2020 | 33,782 | 367,002 |
| 23/04/2020 | 37,160 | 404,163 |
| 24/04/2020 | 40,876 | 445,039 |
| 25/04/2020 | 44,964 | 490,003 |
| 26/04/2020 | 49,460 | 539,463 |
| 27/04/2020 | 54,406 | 593,869 |
| 28/04/2020 | 59,847 | 653,716 |
| 29/04/2020 | 65,832 | 719,548 |
| 30/04/2020 | 72,415 | 791,963 |
| 01/05/2020 | 79,656 | 871,619 |
| 02/05/2020 | 87,622 | 959,241 |
| 03/05/2020 | 96,384 | 1,055,625 |
| 04/05/2020 | 106,023 | 1,161,648 |
| 05/05/2020 | 116,625 | 1,278,273 |
| 06/05/2020 | 128,287 | 1,406,560 |
| 07/05/2020 | 141,116 | 1,547,676 |
| 08/05/2020 | 155,228 | 1,702,903 |
| 09/05/2020 | 170,750 | 1,873,654 |
| 10/05/2020 | 187,825 | 2,061,479 |
| 11/05/2020 | 206,608 | 2,268,087 |
| 12/05/2020 | 227,269 | 2,495,356 |
| 13/05/2020 | 249,996 | 2,745,351 |
| 14/05/2020 | 274,995 | 3,020,346 |
| 15/05/2020 | 302,495 | 3,322,841 |
| 16/05/2020 | 332,744 | 3,655,585 |
| 17/05/2020 | 366,018 | 4,021,603 |
| 18/05/2020 | 402,620 | 4,424,224 |
| 19/05/2020 | 442,882 | 4,867,106 |
| 20/05/2020 | 487,171 | 5,354,277 |
| 21/05/2020 | 535,888 | 5,890,165 |
| 22/05/2020 | 589,476 | 6,479,641 |
| 23/05/2020 | 648,424 | 7,128,065 |
| 24/05/2020 | 713,267 | 7,841,332 |
| 25/05/2020 | 784,593 | 8,625,925 |
| 26/05/2020 | 863,052 | 9,488,977 |
| 27/05/2020 | 949,358 | 10,438,335 |
| 28/05/2020 | 1,044,293 | 11,482,628 |
| 29/05/2020 | 1,148,723 | 12,631,351 |
| 30/05/2020 | 1,263,595 | 13,894,946 |
| 31/05/2020 | 1,389,955 | 15,284,901 |